Crafting or Computing, That is the Question
Huge game worlds are not very common in gaming since they are hard to do both from a technical perspective and a content perspective. There are 2 extremes in creating a world in game development:
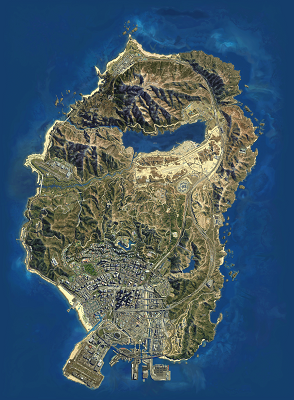
The first option is to hand-craft every piece of content inside your game. If you have the manpower, money and organization, you can create incredibly detailed and huge game worlds. You only have to look at GTA 5 to see what’s possible in that respect.
If you are short on artists but have very clever programmers, you can try and go for the other extreme: procedural generation. Here the computer itself runs through all kinds of sophisticated algorithms to calculate what the game’s content should be for a particular time and place in the game world. This approach is what allows a game like Elite: Dangerous to offer its players a huge universe of 400 billion star systems to fly around in.
In Military Operations we want to have maps that show a a large amount of detail and are historically accurate. For a small independent developer like us hand-crafting all these maps ourselves at the detail level we desire is not an option. It would take too long and cost too much money.
The option of procedurally generating the maps is not feasible either. Procedural generation is a great way to produce a lot of content quickly, but coming up with procedural generation techniques that would produce historically accurate maps is very, very hard, if not impossible. Procedural generation can produce detailed maps that would not be very accurate, which is great for tactical games where you fight for control over a small patch of terrain, but it doesn’t work for an operational game like Military Operations where we want cities, rivers and other major geographic features to be present in the correct locations.
The solution to our problems is to do a bit of both: we start out with accurate map data and use procedural generation techniques to fill in the details. Where do we find this map data? The answer can be found here: the OpenStreetMap project.
Open Data To The Rescue!
OpenStreetMap (OSM) is a geographic database created by a community of contributors and is made available under an open data license. This means that everyone can freely use the data for whatever they want. OpenStreetMap has been around for a long time and the quality and detail of the data in the map has increased substantially over the years.
Because we have worked with OSM data in the past and already have several tried and tested tools to convert it for use in 3D applications, we quickly settled on using OSM data as the “base map source” for Military Operations.
The full OSM database can be obtained from various sources. Depending on the format chosen to download, it can vary in size from 30 GB up to 550(!) GB. Our tools are able to process the highly compressed 30 GB version so we start our conversion by downloading the necessary files in that format.
Hills and Valleys
Great as it is, the data from OpenStreetMap alone is not sufficient to generate a 3D world as we envision it. It simply lacks the height information needed to show hills, valleys, mountains and cliffs. Luckily there is a solution for that as well: back in the year 2000, when the new millennium had barely started, the space shuttle Endeavour flew the so-called “Shuttle Radar Topography Mission” or SRTM for short. The data gathered during this mission is now open and provides us with height data that covers almost the entire world.
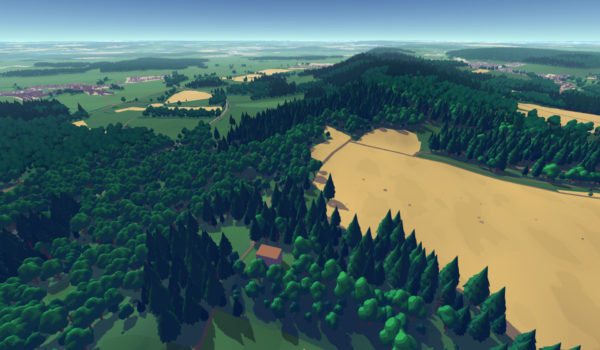
By combining the data from OSM with the data from SRTM, “Metis” (the engine on top of which the game is built), is able to produce a visual representation of any spot on the Earth where we have sufficient data coverage. Luckily for us, the major battlefields of World War 2 happen to have this coverage.
Recipe for 3D
OSM data comes in 3 types: nodes, which are simply points at specific locations on the Earth; ways, which are groups of points that define a feature, like a road, building or forest area; and relations, which are used to define more complex features consisting of multiple ways and/or nodes. Each data element has a set of tags that define what it represents in the real world. For example, all buildings have the tag “building” attached to them.
In the first processing step, all this information is converted into three kinds of geometry: points, lines and polygons.
The Metis engine requires the data to be subdivided into tiles at several levels of detail in order to stream & visualize it in real-time, so the second processing step does just that:
It partitions the points, lines and polygons into tiles and creates multiple levels of detail. For low detail levels, small features that cannot be seen from afar are simply discarded. Larger features are first simplified so that smaller details that cannot be seen are removed, meanwhile preserving the general shape. This process ensures that tiles at lower detail level, although covering a greater surface area, have more or less the same size as tiles at higher detail levels. This is an important condition for the engine to be able to visualize everything in real-time.
The third processing step converts these geometries into several groups and each group gets its own special treatment:
Forest areas, for instance, get tagged with a special code that triggers the engine to generate trees in those areas; building footprints are turned into 3D models and placed at the correct height based on the terrain information from SRTM.
The final processing step produces the game files used by the engine by combining and compressing the generated data. The entire process can be summed up like this: (click on each image for an enlarged version)
Rewinding the Clock
“But wait!”, I hear you say, “this is all fine if you want to visualize the Earth as it is TODAY, but this is not what it looked like during World War 2!”. And you’re absolutely right about this! 75 years ago, there were no highways to quickly drive from Luxembourg to Brussels and most cities were much smaller than they are today.
Since our tools produce data based on the input from OSM and SRTM, the only thing we need to do, is to modify the source data so it matches the situation during World War 2. Using historical maps and other sources we can modify the source data so it contains features matching the historical situation. Using this historical database, the tools will then produce a historical 3D map.
For the SRTM height data, this problem is less pronounced, since most mountains are still where they were back then as are most valleys and hills, so corrections for this data will be needed less frequently
Returning the Favor
The maps of World War 2 we produce in this manner will become open data just like the data we use from OpenStreetMap. Its open data license clearly specifies that creating a “derived work” from it, requires that “work” to be available to everyone under the same license. In this case, our map definitely constitutes a “derived work” and so will be made available to the public.
Comments and reactions to this blog entry can be made on our forum.
Share: